
How long will it take to adopt a Zero Covid Strategy?
Published:
In this post, I try to get further information on how long does for a Zero Covid strategy to get to the end of the first phase and I provide a tool to play with the parameters on Google colab.
Disclaimer
The discussion in this post is a simplification of the model in reality. In particular, I will not consider now the introduction of new more infective variants (I will consider it in future) and the fact that when number of cases are very low, the SIR model does not make much sense, and we should pass to a discrete model.
What is a Zero Covid strategy?
As the name suggests, the goal of this strategy is to bring the number of cases to the lowest possible (zero). This has been already done in some countries as New Zealand, Australia or Taiwan. It consists of different phases.
- A first one, where a strong lockdown is imposed until the number of cases decreases below a threshold (around 10 per week over 100,000 population, but different experts said different numbers between 2.5 and 50)
- A second phase where many restriction are lifted, the contact tracing is effective and a zone system is employed. This means that every time a zone reaches a number of cases higher than the tolerance, it falls back into a local lockdown, until the number are limited again. The clou ingredient of this phase is that each case should be always reconduct to a previous one. In the event of a case with unknown origin, the zone falls back in the previous phase.
- A third phase in which each zone, where the number of cases is zero, is set free. Again, as soon as new cases are found it falls back in the previous phases.
This strategy has been already employed in different countries outside central Europe. It is remarkable that also in Europe similar techniques (meaning different geographical zones ruled by different levels of danger) have been adopted. For example, Italy follows a 3 phases strategy, where each phase does not pursue the goal of reaching the traceability of the cases. Clearly it is not enough to bring cases to zero. Lately, Germany started imposing a stronger lockdown in the last months and it is aiming to decrease the number of cases below a certain threshold which is still debated between government and Lands.
How the pandemic would behave during the strategy?
The pandemic can be modeled using many simplifications with a SIR model (symptomatic, infected, recovered). This model, when far from the herd immunity, behaves exponentially in both directions. Meaning that the number of cases evolve as $I=Ce^{(R-1)t}$, where C is a constant depending on the infection, R is the reproduction number of the disease and t is time. The measures adopted by a country (ignoring borders effects) modify directly the reproduction number $R$. In the picture below we can see the behavior of the cases varying in time if $R>1$ (on the left) and if $R < 1$ on the right.
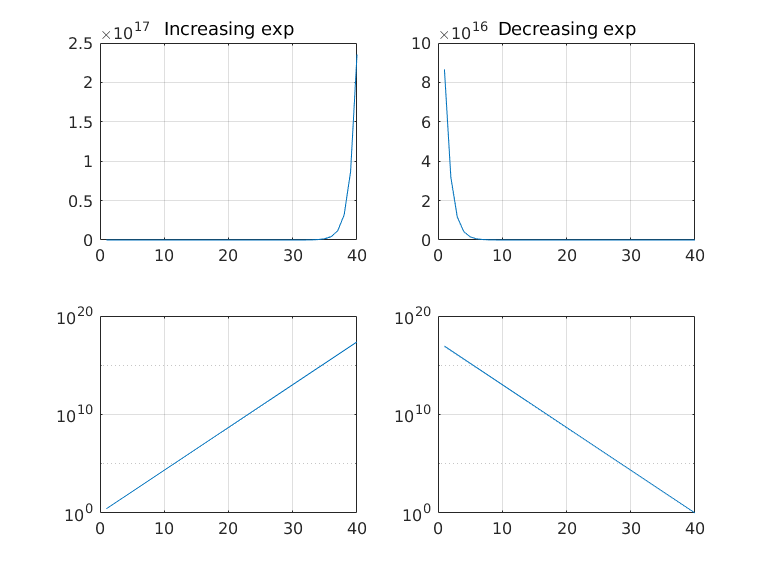
For human beings it is difficult to catch the exponential behavior, that is why we often use a logarithmic scale to better understand it. In this scale, we see that the logarithm of the infections behaves linearly with time $\log (I) = C_1+ C_2(R-1)t$. In particular, we notice that the number of infections doubles at a fixed time, for $R>1$ and gets the half every $N$ days when $R <1$. Without getting too complicated with different variants of the virus and so on, we try to focus on a strategy that brings $R$ to certain values and keeps it for a certain time.
It is now interesting to understand what is the halving time for the development of the pandemic. This can tell us when the Zero Covid phases should change to the next one.
How to forecast the time needed in lockdown before the new phase?
Let us look at the Covid cases in New Zealand. There were few cases at the benning of April, then the Zero Covid strategy was applied.
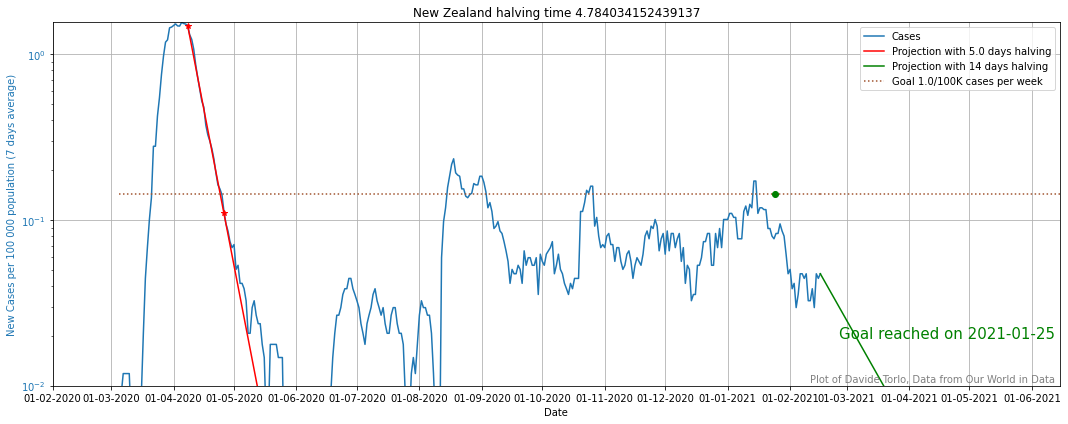
There the peak was of around 2 detected cases per day per 100,000 inhabitants, which was brought to almost zero in around one month. In particular, we see that in the logarithmic scale, they were able to halve the detected cases every 5 days.
If we come back to Europe we can observe similar behaviors, but with way higher numbers. In Italy, after the secod wave, we observe a negative exponential behavior as well in May, where the testing was more consistent in the country. There the halving time was of 14 days. At that time they could have reached the goal of 1 case per week per 100,000 inhabitants by continuing the measures that were on in May till the beginning of July. On the contrary, restrictions were lifted and the exponential inverted around mid July.
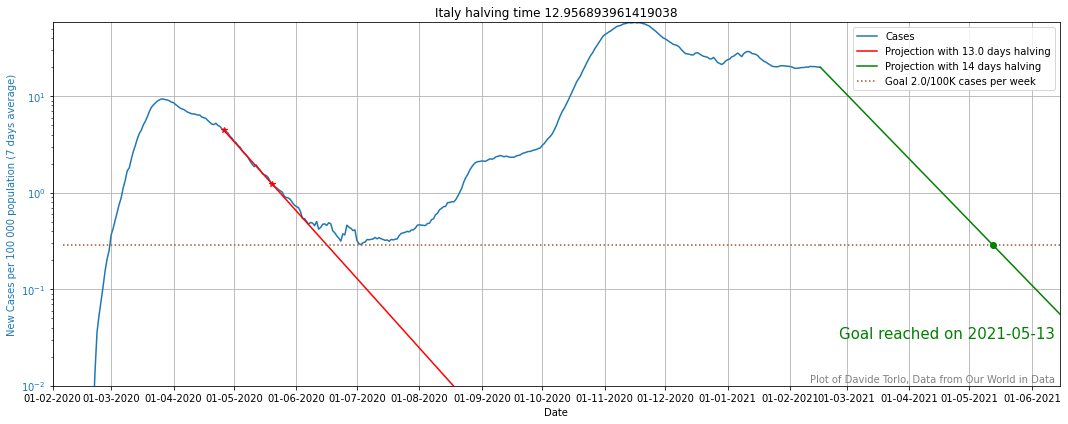
The past is gone and the question is: if Italy applies the same measures kept on May 2020 from now, when will the goal of 1 case per week per 100,000 inhabitants will be reached? Supposing that the testing is working more or less fine and that the virus did not mutate too much (which is not true, it worsened), we can forecast the cases for the new lockdown.
The green line shows that by the beginning of May 2021 Italy could reach the number of cases of the last summer (2020) and by the end of May 2021 the threshold of 1 case per week per 100,000 inhabitants.
During the second wave the rules were less strict and different in each region, leading to a larger $R$ and a less effective strategy: halving time of about 19 days.
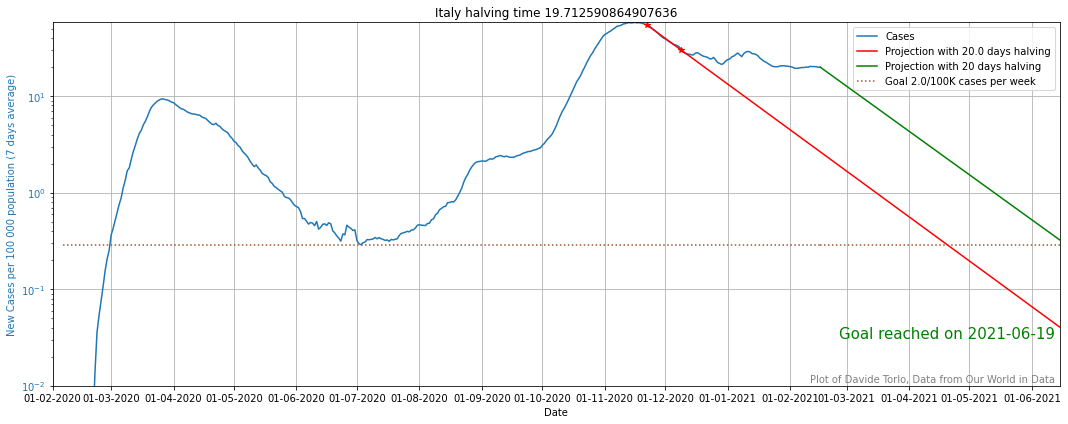
Using this strategy now, it would last till mid June 2021 to have the same cases of summer 2020.
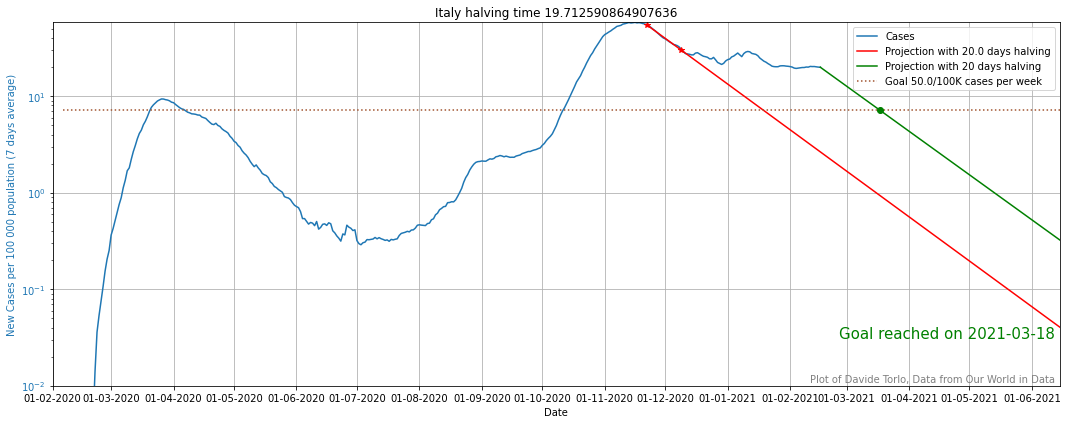
While if Italy wants to reach 50 cases per week, one month with the red zone measure of the second wave should be enough.
Play with the tool
These plots have been produced with a simple python script which is available on Google Colab. There you can put all the countries of the world and play with the parameters. Simply start the script with the play button on the top left of the code box and then tune the parameters:
- Data to consider to compute the halving time: starting date and Data interval
- Halving time of the projection starting from now
- Goal to be reached
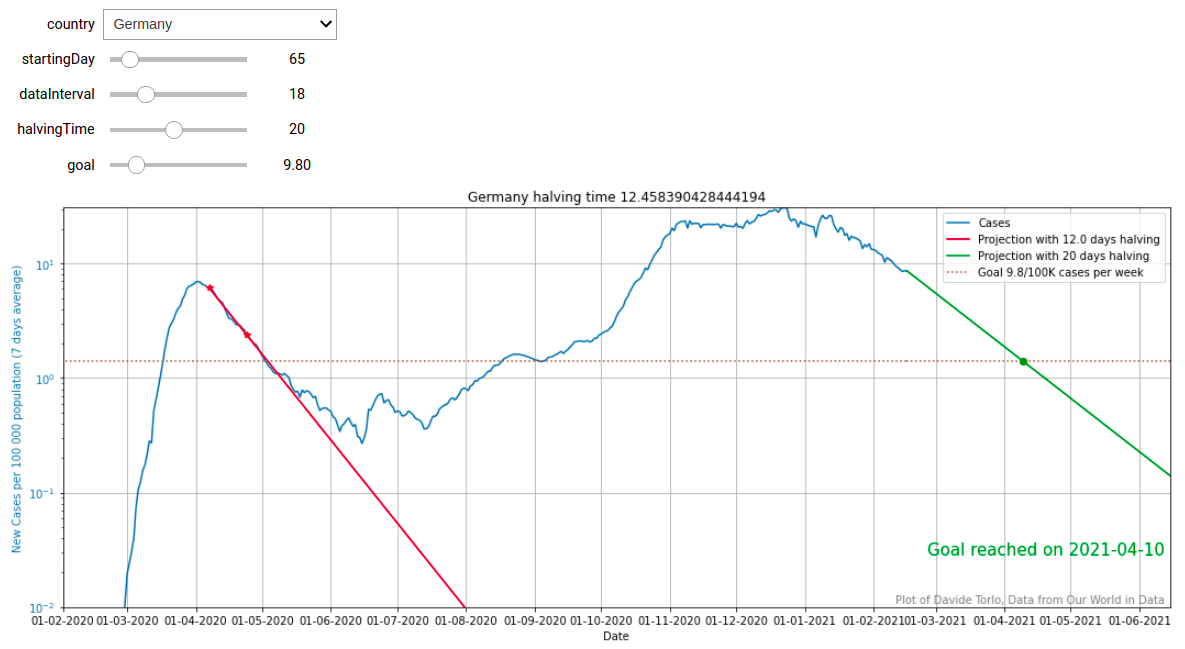 As an example, here we set Germany to be the country of interest, we see that during the first wave the halving time was about 14 days and now it is of around 20 days. We can imagine that keeping this pace it will reach the goal of 2.5 cases per week per 100,000 inhabitants by beginning of June.
Conclusions
Clearly, reaching 1 case per 100,000 per week would take too long with a lockdown, but reaching 50 or 30 cases per 100,000 per week in order to make the contact tracing still effective is doable in a month or two of not too strict lockdown measures.
Now, the objective stays in tradeoff between the cost for decreasing the cases and the goal that we want to achieve in order to make contact tracing as effective as possible. I think in the next months the European countries will try to find a good compromise in this.