
How is testing going for different World countries for the SARS-CoV-2 pandemic
Published:
This post is based on the observation I made some months ago in a Twitter post.
Summary
Basic Knowledge on the Fatality rate of the Virus
It is clear at the moment, that the SARS-Cov-2 has a case fatality rate (CFR) which highly depends on the age and the co-existence of other illnesses. In particular, the CFR depends exponentially on the age [1] as shown also by ourWorldInData.
For an average European country it has been estimated that the CFR should be in the interval 1%-1.5% (with the original variant, in the future it might change). This piece of information can be used to determine the quality of the testing strategy and capacity of a certain country (and soon which variant will be dominant in the country). Indeed, from communicated cases and deaths, we can estimate the apparent CFR and compare it with the expected one.
France, Germany, UK and Italy and their testing systems
In particular I set up an Ipython notebook where one can compare the cases and the deaths supposing an apparent CFR and the delay between the report of the cases and the report of the death (in Italy estimated in about 12 days).
| Fatality 2% | Fatality 3% |
|---|---|
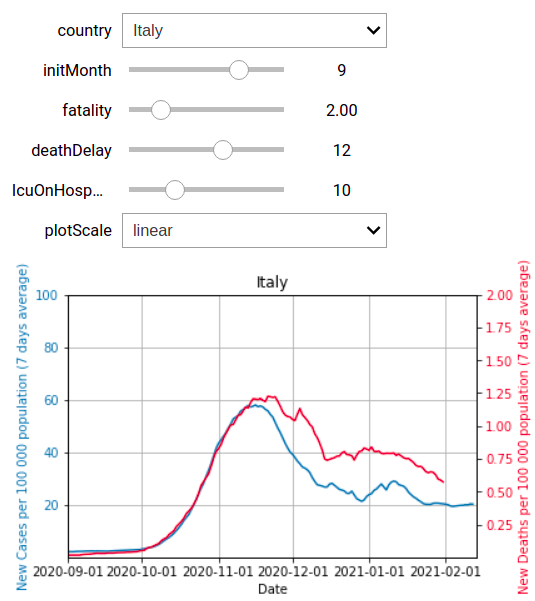 | 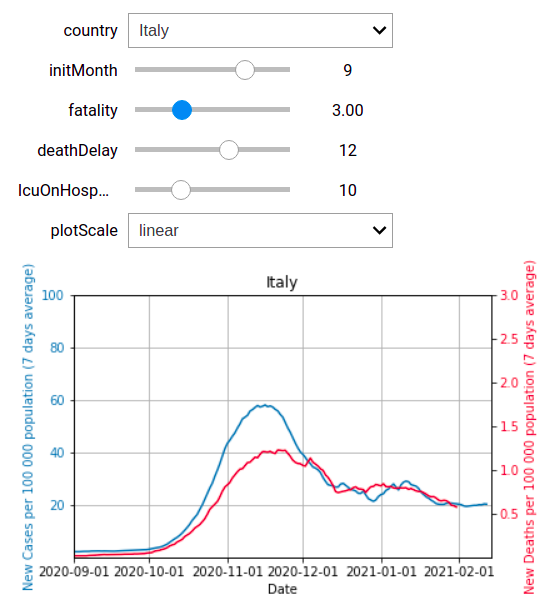 |
From the pictures above it is clear that in Italy the apparent CFR moved from a 2% of the beginning of the first wave to a 3% after the peak of the second wave. This may be caused by different factors. It is evident that the testing strategy and the case tracing may lose quality as the number of cases increases. Another factor could be that the percentage of older cases increased in time. Unfortunately, in Italy the positivity rate of the PCR test divided by age is not available, so we cannot compare directly this hypothesis. In France this data is available Age rate France and we can see how the spread of the pandemic starts in every wave from the younger population and spread towards the older one (in France schools were rarely closed, in particular in the age 0-11). This can explain their CFR which varies a bit along the second wave (minimum of 0.7 before the second wave and maximum around 3 before the second plateau of cases).
| Fatality 1.3% | Fatality 2% |
|---|---|
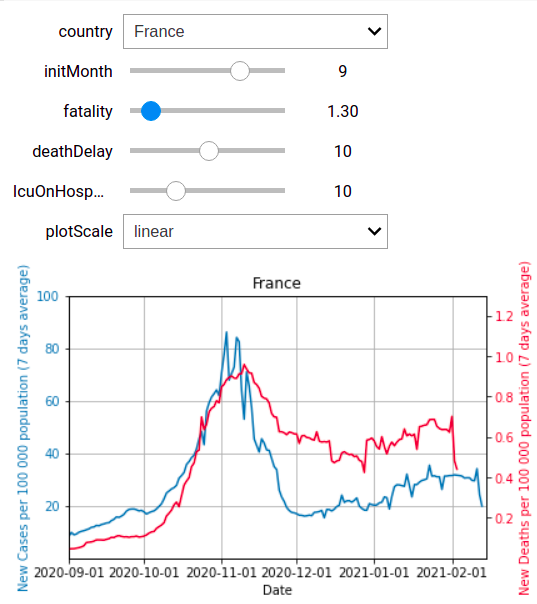 | 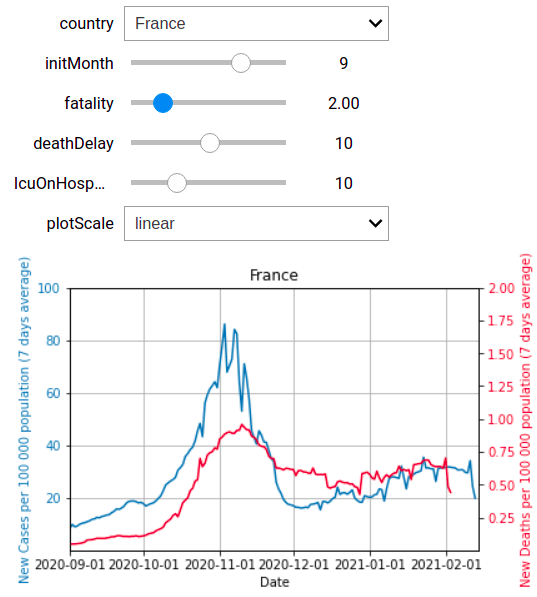 |
In Germany we can observe a net change in the testing strategy that was recommend by the Robert Koch Institute. Before mid November the apparent CFR was 1%, result of a very good tracing system and testing strategy, while after the change, due to capacity limits, the fatality raised constantly till 4% of mid January. We can imagine that the unreported cases could be at least the 75% of the total ones.
| Fatality 1% | Fatality 4% |
|---|---|
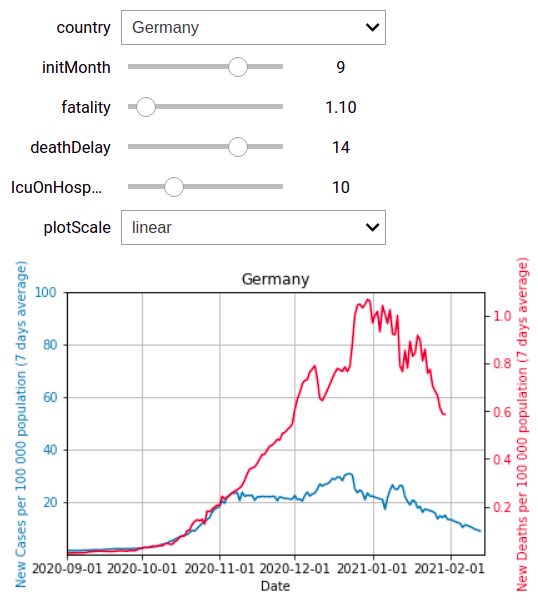 | 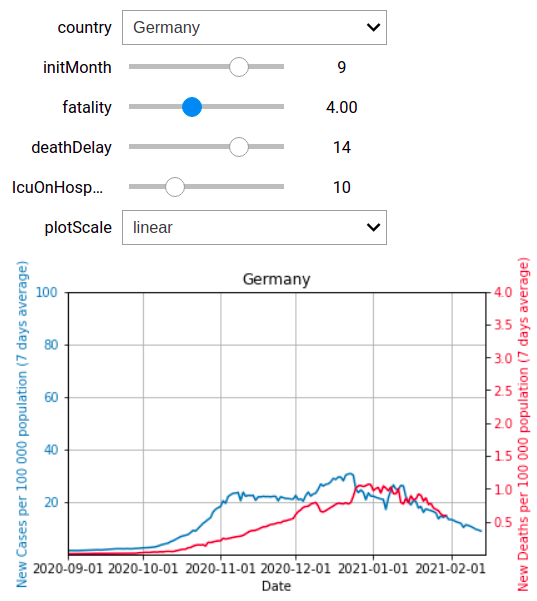 |
UK seemed also to have a stable testing strategy and the apparent CFR which varies between 1 and 2.5 even after the peak of the second wave, which is probably due to the new variant, which seems to be more fatal.
| Fatality 1.9% | Fatality 2.4% |
|---|---|
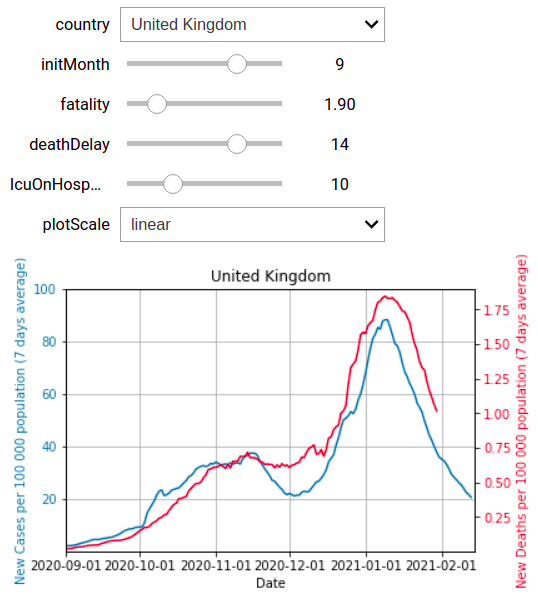 | 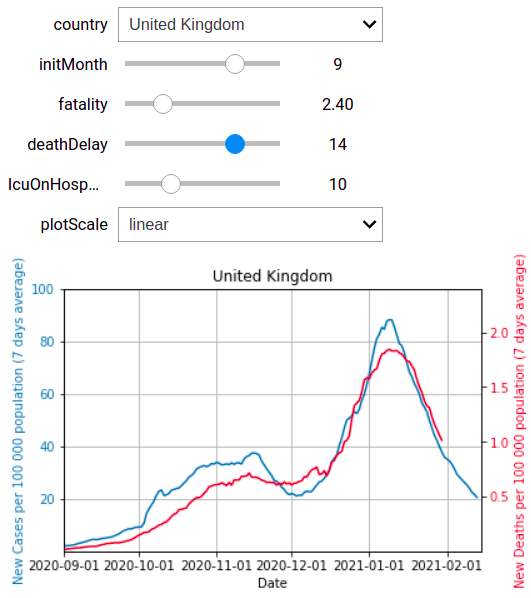 |
Future
In Germany and UK strong opinions on Zero Covid strategy are under consideration by the government. They share the goal of bringing down the cases to numbers lower than 2.5 cases over 100,000 people every week. This should allow a better testing and contact tracing strategy and, hence, a lower CFR. In other countries this policy has not been considered yet, but may be incouraged by the rest of EU.
[1] Undurraga, E.A., Chowell, G. & Mizumoto, K. COVID-19 case fatality risk by age and gender in a high testing setting in Latin America: Chile, March–August 2020. Infect Dis Poverty 10, 11 (2021). https://doi.org/10.1186/s40249-020-00785-1