Covid Plot Italia
Published:
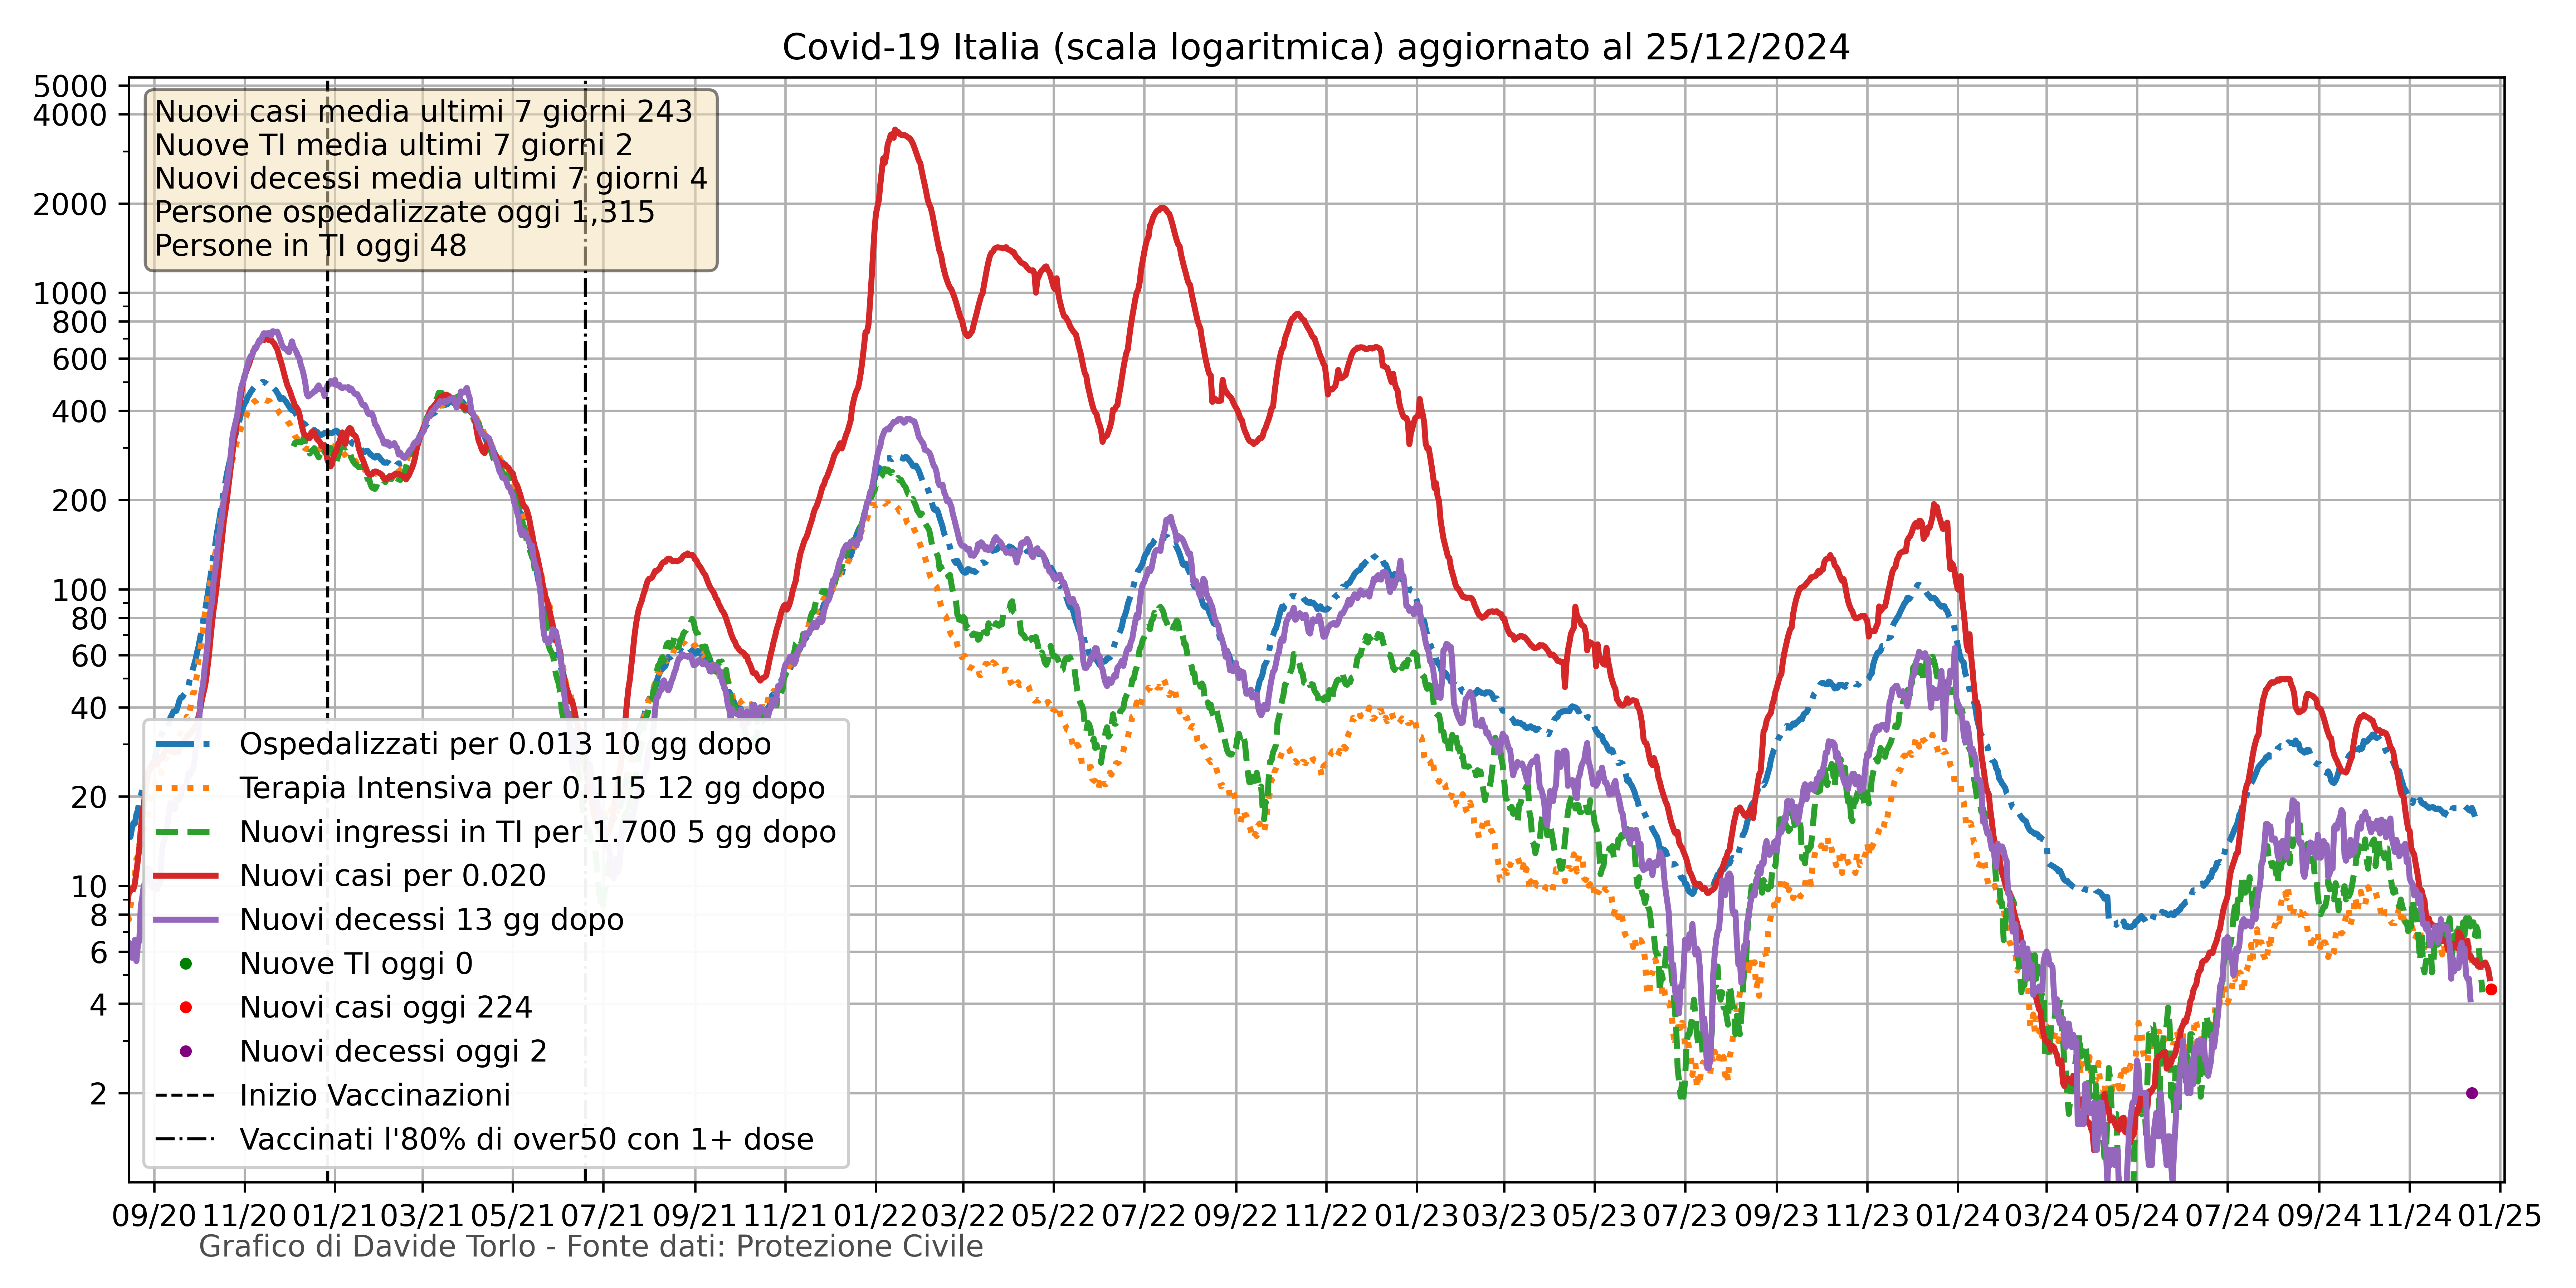
Here I show the updated picture of all cases, deaths, hospitalized, ICU of Italy. All lines are shown in one plot with a rescaling factor. The y-axis is in logarithmic scale. Data is taken from the github repository of Protezione civile.

To obtain this plot I used this script, whose Colab version is available here.
